We precisely measure quantitative traits in disease states of interest
We deployed non-invasive imaging in nearly all of our ~8,000 patients. These proprietary images are analyzed in a central core laboratory to quantify factors relating to disease states of interest, including:
- Atherosclerotic plaque
- Liver fat and fibrosis
- Bone density
- Muscle mass and muscle quality (fatty infiltration)
This data means we do not need to rely on electronic medical records, ICD-10 codes, what the patient or what the physician says – our data speaks for itself.
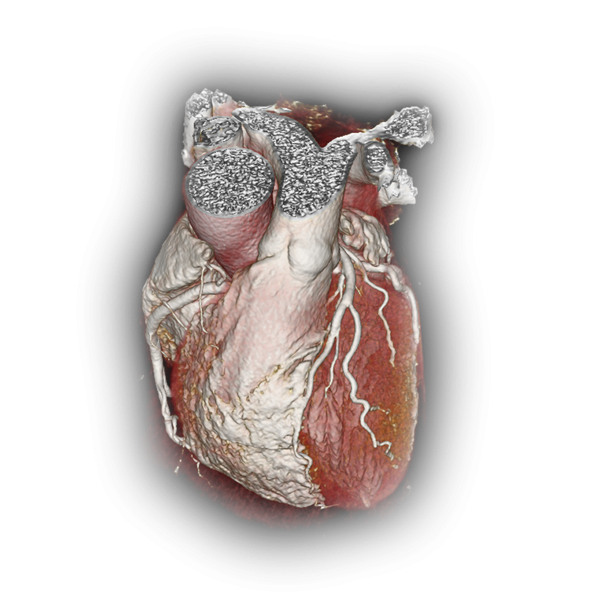
Characterising atherosclerotic coronary artery disease
We quantify the amount and precise composition of coronary arterial plaque
- The core laboratory collects over 400 measurements and datapoints from the coronary arteries
- We precisely quantify the composition of atherosclerotic plaques, including features of vulnerability that could contribute to rupture
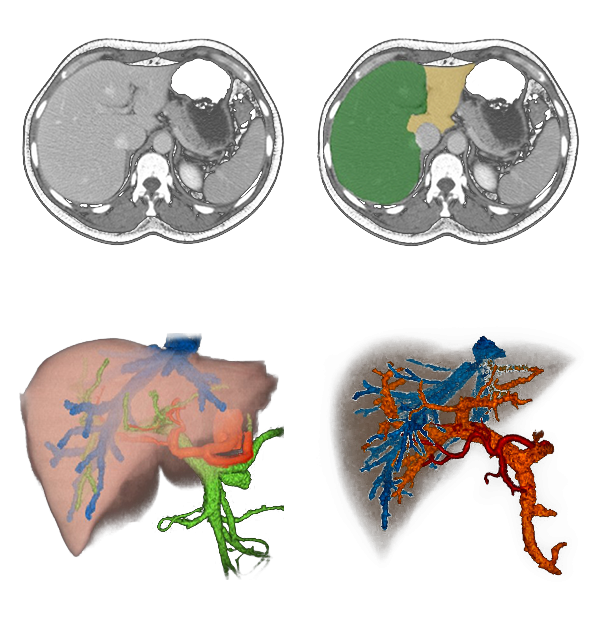
Characterising fatty liver disease
We precisely quantify the amount of fat (“Steatosis”) and the amount of fibrosis in the liver
- We identify the spectrum of fatty infiltration and the degree of fibrosis in all patients
- We use sophisticated texture measurements and other liver features to quantify the degree of fibrosis in the liver
- Liver biopsy is significantly limited by only evaluating a very small portion of the liver and is hindered by “geographic miss”. On the other hand, we evaluate the liver in totality and quantify liver fat and fibrosis in the entire organ
Deep
learning
Take EVERY panomic and molecular datapoint as above and generate scientific insights in an unbiased, hypothesis-free approach.